Goals and Objectives: The
objectives of this lab were to create a map in which you could safely place
bears, but it must fall under a few specific categories. The bears needed to be
in a geological location in which *most* (at least 70%) of the other bears live,
they must be placed at least 5km away from any residential area, and within the
DNR management land. This lab was created to show that us as students were able
to use the tools in Arc Toolbox correctly, and that we are capable of creating
intricate maps with a significant value in society.
Methods:
To begin, I first plotted the points of every bear location within Marquette
County Michigan. I then also added the geological map of the county. I spatially
combined the bears with the geological locations to figure out which were the
most prominent areas in which the bears lived. 62 out of the 68 lived within
evergreen forests, forested wetlands, or mixed forest. And because this was so prominent,
placing a bear in one of these three areas became one of my goals, as these
were their main habitats. I then placed the streams layer to the map, (in the
lab it says biologists indicated streams are important), and added a 500m
buffer to the feature, as I would like to place bears close to a water source
where they may drink or eat fish. I had now found a suitable bear habitats.
The
next task became to only use the area that the DNR had control over. I plotted
the DNR management areas, then clipped the area that was not within the
suitable habitats. This gave me the area that the DNR could place the bears
within the correct habitat and under their control. Objective 5 was to make
sure that area was not within 5km of a residential land or build-up. This wasn’t
too hard, I just added a 5km buffer around the residential land/build-up and dissolved
it. This then made a large bubble chain, in which I erased away from the suitable
DNR land, leaving me only with the land that bears could live in their correct habitat,
5km away from any residential land/build-up, and under the DNR’s control. These
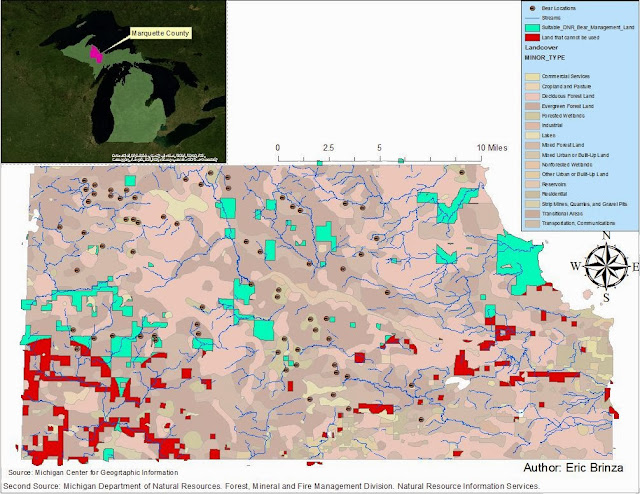
are the areas in which bears may be placed. That actually is the result of my
map as shown below.
Results: Below is the map showing
land that could be used by the DNR in turquoise, and the land that could be
used, but is also 5km within a residential/build-up area in red (indicating do
not use). The points plotted are where all current bears have been reported as
spotted, and I also added the streams to the map. Below that, you will find a
dataflow model for each of the tools used in the creation of this map, and
which steps they were on.
Landcover DNR Management units Streams


No comments:
Post a Comment